You read the headline: "Stock Soars 300% on AI Hype." You feel the FOMO twist in your gut. You see another: "Market Plummets on Inflation Fears." The anxiety follows. Your money is in a savings account, losing value, or scattered in a few stocks you heard about on a podcast.
The idea of "market analysis" feels like trying to read a radar screen in a language you don't speak. So you do nothing. The paralysis costs you more than any bad trade ever could.
I worked adjacent to professional analysts. I saw the rooms full of screens, the complex models. It felt like a fortress I could never enter. Then a mentor told me, "The pros aren't looking for secret codes. They're looking for mismatches between story and reality. You can learn to see those too."
You don't need to become a Wall Street quant. You need a filter—a way to separate the signal from the endless noise. Profitable investing isn't about predicting the future. It's about assessing the present with a clear, disciplined framework that tilts the odds in your favor. Let's build that filter.
The Expert Mindset: You're a Detective, Not a Fortune Teller
Forget crystal balls. Think like a detective on a cold case. Your job is to gather evidence about a company's health and the market's mood, then see if the popular story about them holds up.
The "story" is the narrative—the hype, the fear, the headline. The "reality" is the hard data in financial statements and economic reports. Profitable opportunities often live in the gap between the two.
Your goal is not to find "the next big thing." It's to avoid catastrophic losses and identify durable opportunities where the reality is stronger than the story. This is how you secure investments, not gamble.
Layer 1: The Macro Filter - What Tide Are You Swimming In?
You don't analyze a fish in a bathtub. You look at the ocean first. This is top-down analysis.
Ask three big-picture questions:
- What is the cost of money? (Interest Rates)
- Check: The Federal Reserve's statements and the 10-Year Treasury Yield.
- What it tells you: Are we in a "cheap money" or "expensive money" environment? High rates hurt companies that borrow a lot (like tech growth stocks). They help banks and can signal a slowing economy. This sets the stage for everything else.
- Are people spending or hiding? (Consumer Strength & Inflation)
- Check: The Consumer Price Index (CPI) report and Retail Sales data.
- What it tells you: Is inflation eating away purchasing power? Are retail sales growing or shrinking? This tells you the health of the consumer—the engine of the US economy. Weak consumer = trouble for most stocks.
- Is the world stable or chaotic? (Geopolitical & Systemic Risk)
- Check: You're not reading intelligence briefings. Look at the Volatility Index (VIX)—the "fear gauge." Look at oil prices. Read headlines not for predictions, but for themes.
- What it tells you: Is the market fearful or complacent? Spiking oil prices hurt transportation and manufacturing. A high VIX means uncertainty reigns, which often leads to market swings.
Your Macro Takeaway: You don't make investment decisions here. You get a weather report. Is it sunny, stormy, or foggy? This tells you whether to be aggressive, defensive, or cautious. In a hurricane warning (high rates, high inflation, spiking VIX), you don't go sailing in a dinghy (buy risky small-caps). You stay in the harbor (hold cash, buy bonds, stick with essentials).
Layer 2: The Company Filter - The "DuPont Detective" Work
Now you look at a specific company. You're checking its vital signs. Focus on three core financial statement metrics anyone can find (on Yahoo Finance, your brokerage platform).
- The Profitability Check: Is it actually making money?
- Metric: Profit Margin (Net Income / Revenue). Look at the trend over 5 years.
- The Story vs. Reality Test: The story might be "explosive growth!" The reality check: Are sales growing while profits are shrinking? That's a red flag. A durable company grows profits as fast or faster than revenue.
- The Financial Health Check: Can it survive a bad year?
- Metric: Debt-to-Equity Ratio (Total Liabilities / Shareholders' Equity). Compare it to other companies in the same industry.
- The Story vs. Reality Test: The story might be "aggressive expansion!" The reality check: Is the company piling on debt to fuel growth? A high and rising D/E ratio means it's fragile. When the macro tide goes out (interest rates rise), highly indebted companies drown first.
- The "Cash is King" Check: Is the money real?
- Metric: Free Cash Flow (FCF). This is the cash a company generates after paying for its operations and maintaining its assets. It's what's left to pay dividends, buy back stock, or invest in growth.
- The Story vs. Reality Test: The story might be "tech visionary!" The reality check: Is the company burning through cash with no path to positive FCF? Profits can be accounting magic. Cash flow is much harder to fake. Consistently positive and growing FCF is a hallmark of a quality business.
Layer 3: The Sentiment Filter - What is Everyone Else Feeling?
This is about gauging the market's emotional temperature toward your investment.
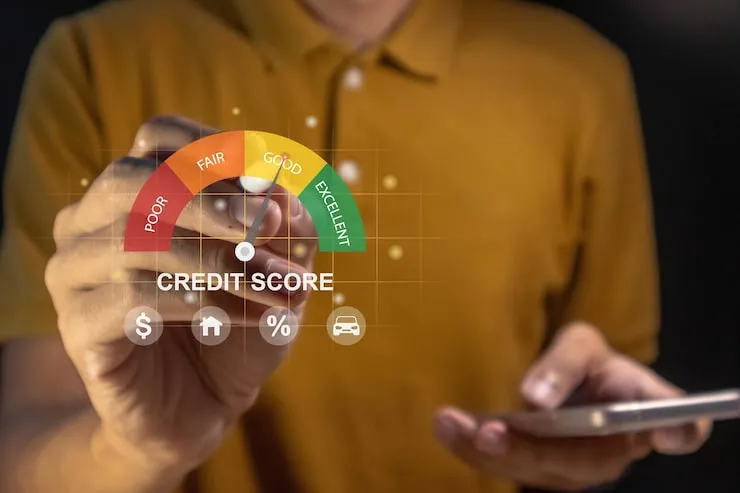
- The Valuation Check: Look at the Price-to-Earnings (P/E) Ratio. Now, compare it to:
- The company's own historical average P/E.
- The average P/E of its industry peers.
- The Story vs. Reality Test: The story might be "this is a must-own leader!" The reality check: Is it trading at 60 times earnings while its competitors are at 20? That means the "good story" is already baked into an extremely high price. You're not buying a company; you're buying expensive hype. The most profitable investments are often found in solid companies with moderate valuations that the crowd is ignoring.
Your "Secure Investment" Action Framework
You don't need to do this for 100 stocks. Do it for one you're curious about.
- Get the Weather Report: Quick scan. What's the Fed doing? Is the VIX high or low? This tells you your overall stance (Cautious/Neutral/Aggressive).
- Pick a Company & Be a Detective: Choose one company from an industry you understand. Go to its Yahoo Finance page. Write down:
- 5-year Profit Margin trend (Up, Down, Flat?)
- Its Debt-to-Equity Ratio vs. a main competitor.
- Is Free Cash Flow positive?
- Check the Price of the Story: Look at its P/E ratio. Compare it to its 5-year average and one competitor's. Is it priced for perfection?
- Make the Call: Does the financial reality (Layers 1 & 2) support the current market story (Layer 3)? If the company is healthy (good margins, manageable debt, positive cash flow) but the market is pessimistic about its sector (low P/E relative to history), you might have found a secure, profitable opportunity. If the story is euphoric but the financials are weak, you've just avoided a potential disaster.
The Expert's Secret: Inaction is an Action
The most powerful tool in market analysis is the ability to say, "I don't know enough, so I won't bet." Most professional capital is preserved not by brilliant buys, but by avoiding stupid losses.
You secure profitable investments first by securing your capital from your own impulses. You use this filter to talk yourself out of bad ideas. The good ideas that survive this three-layer scrutiny will be few and far between—and that's exactly the point.
Profits are made in the buying. You buy when your clear-eyed analysis shows you a mismatch in your favor: a strong reality, available at a price the fearful or inattentive market is offering. That's not luck. That's the secure path.
FAQs: Expert Market Analysis
I don't have a finance degree. Can I really do this?
Yes. You are not building a quantitative model. You are being a literate, skeptical observer. Understanding what a profit margin or debt ratio means is more important than calculating it from scratch. The data is published and easy to find. The analysis is about asking simple "why" and "compared to what" questions.
Where do I get this data for free?
Yahoo Finance and Google Finance are excellent free resources. Type in a ticker symbol (e.g., "AAPL"). Go to the "Statistics" or "Financials" tab. All the key metrics (P/E, Profit Margin, Debt/Equity) are listed there in plain English. For macro data, the FRED Economic Data website (from the St. Louis Fed) is a treasure trove.
How often should I do this analysis?
For the Macro Filter, a monthly check-in when major reports (CPI, Fed decision) are released is enough. For a specific company you own or are watching, a deep dive every quarter (when earnings are reported) is sufficient. Constant monitoring leads to emotional trading. Good companies don't change fundamentally every day.
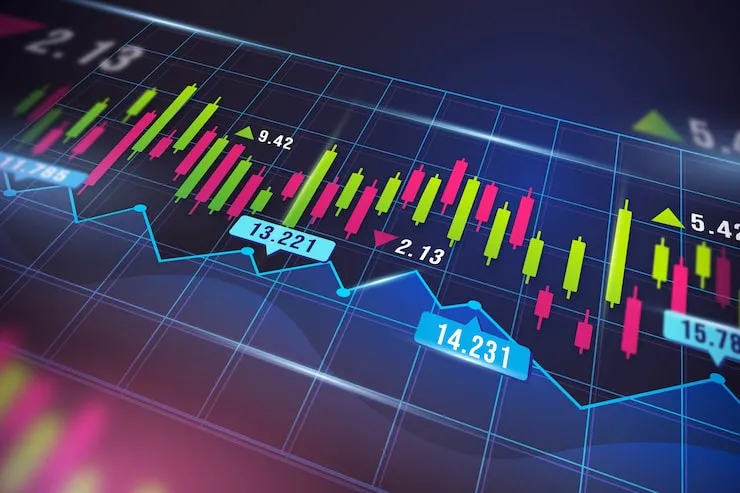
Is technical analysis (chart reading) important?
It can be a useful timing tool for entry/exit, but it is a terrible fundamental tool for deciding what to buy. It tells you about market psychology and momentum in the short term. It does not tell you if a company is financially healthy. Always start with fundamentals (the detective work). Use charts last, if at all, to avoid buying at a moment of peak euphoria on the chart.
What's the biggest mistake beginners make with analysis?
Confusing a good company with a good investment. A company can be fantastic—great products, strong profits—but if the stock price is 100 times earnings, it's a terrible investment at that moment because all the future success is already priced in. The analysis must connect the company's quality to the price you have to pay.
This seems slow. Can't I just buy index funds?
You absolutely can and should. For 95% of people, consistent investment in low-cost index funds (like VTI or VOO) via dollar-cost averaging is the single most secure and profitable long-term strategy. This analytical framework is for the portion of your portfolio you might actively manage (if any) and, more importantly, to give you the confidence to stay the course with your index funds when headlines get scary, because you can understand the context.